En esta sección
Status displays
Status dashboards include general transaction information to get an overall impression of how the business is doing at all times.
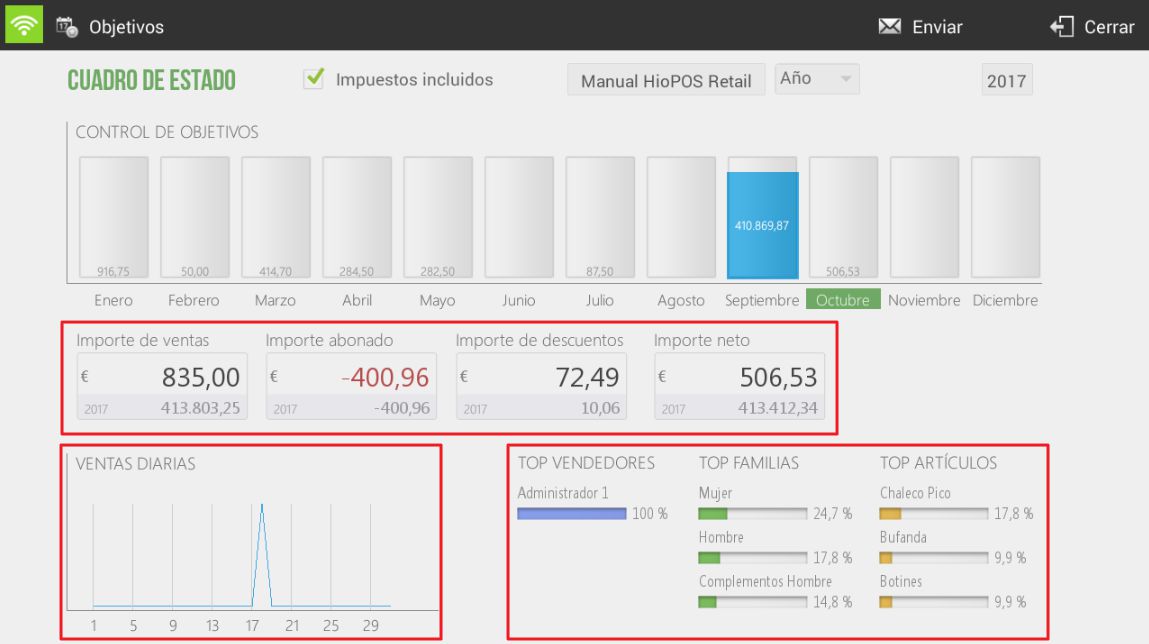
At the top are the filter options to get a more personalized result. We can see the values with or without taxes, select the store we want to view, and the year.
Under the status panel are found the total values of the Sales amount, Amount paid, Discount amount, and Net amount.
The daily sales graph shows a representation of the sales totals for the selected month. Next to it are, with their percentages of the total, the Top Sellers, the Top Families, and the Top Items.
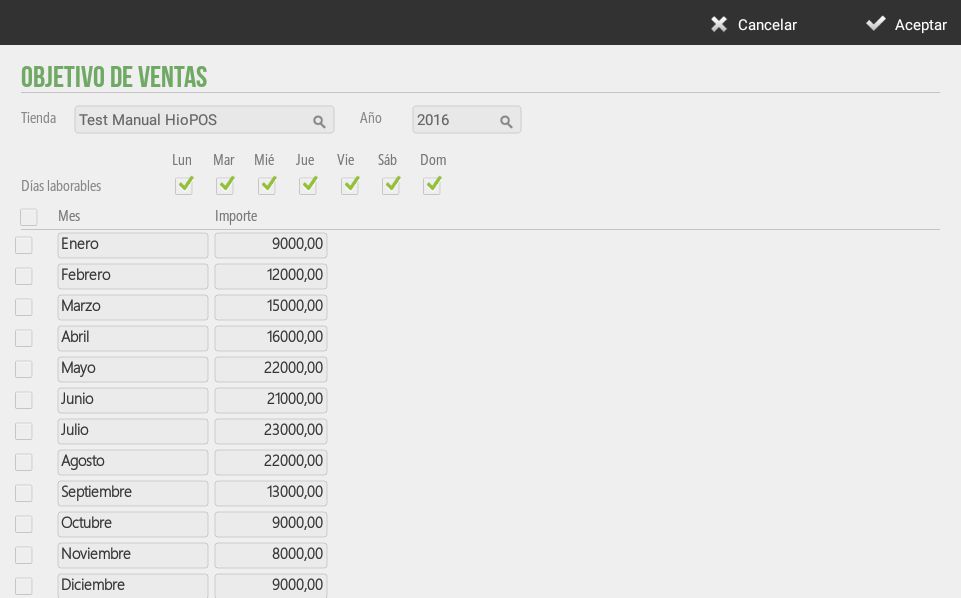
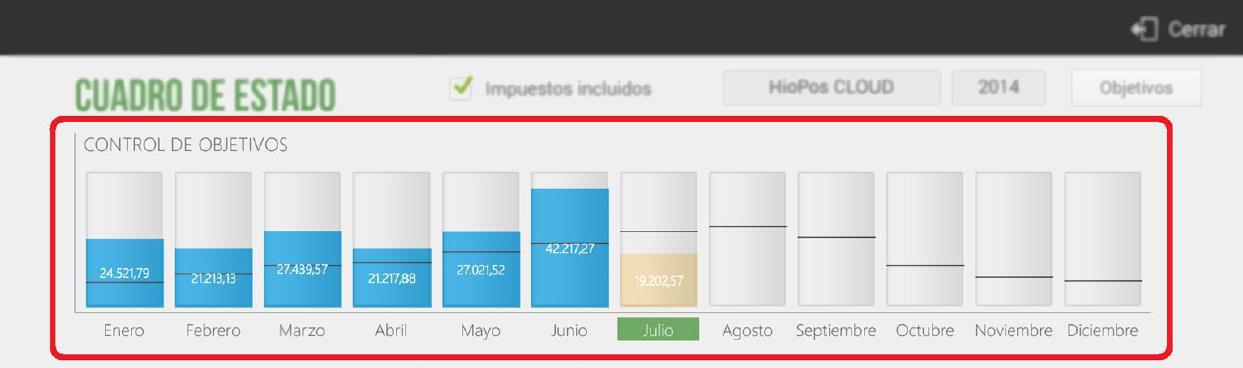
Also at the top is the Goals option, where we can set sales targets that will appear represented in the cubes of the status dashboard, allowing for a quick and visual comparison.

Goal tracking displays the total monthly sales value in a visual cube format, along with the numerical amount and a line indicating, for each month, the target value.
AI Assistant
Section summary
AI can generate inaccurate information; verify the results.