En esta sección
Dashboard
The initial HiOffice dashboard provides key business information. From it, various information panels can be viewed across different timeframes (day, week, month, quarter, and year).
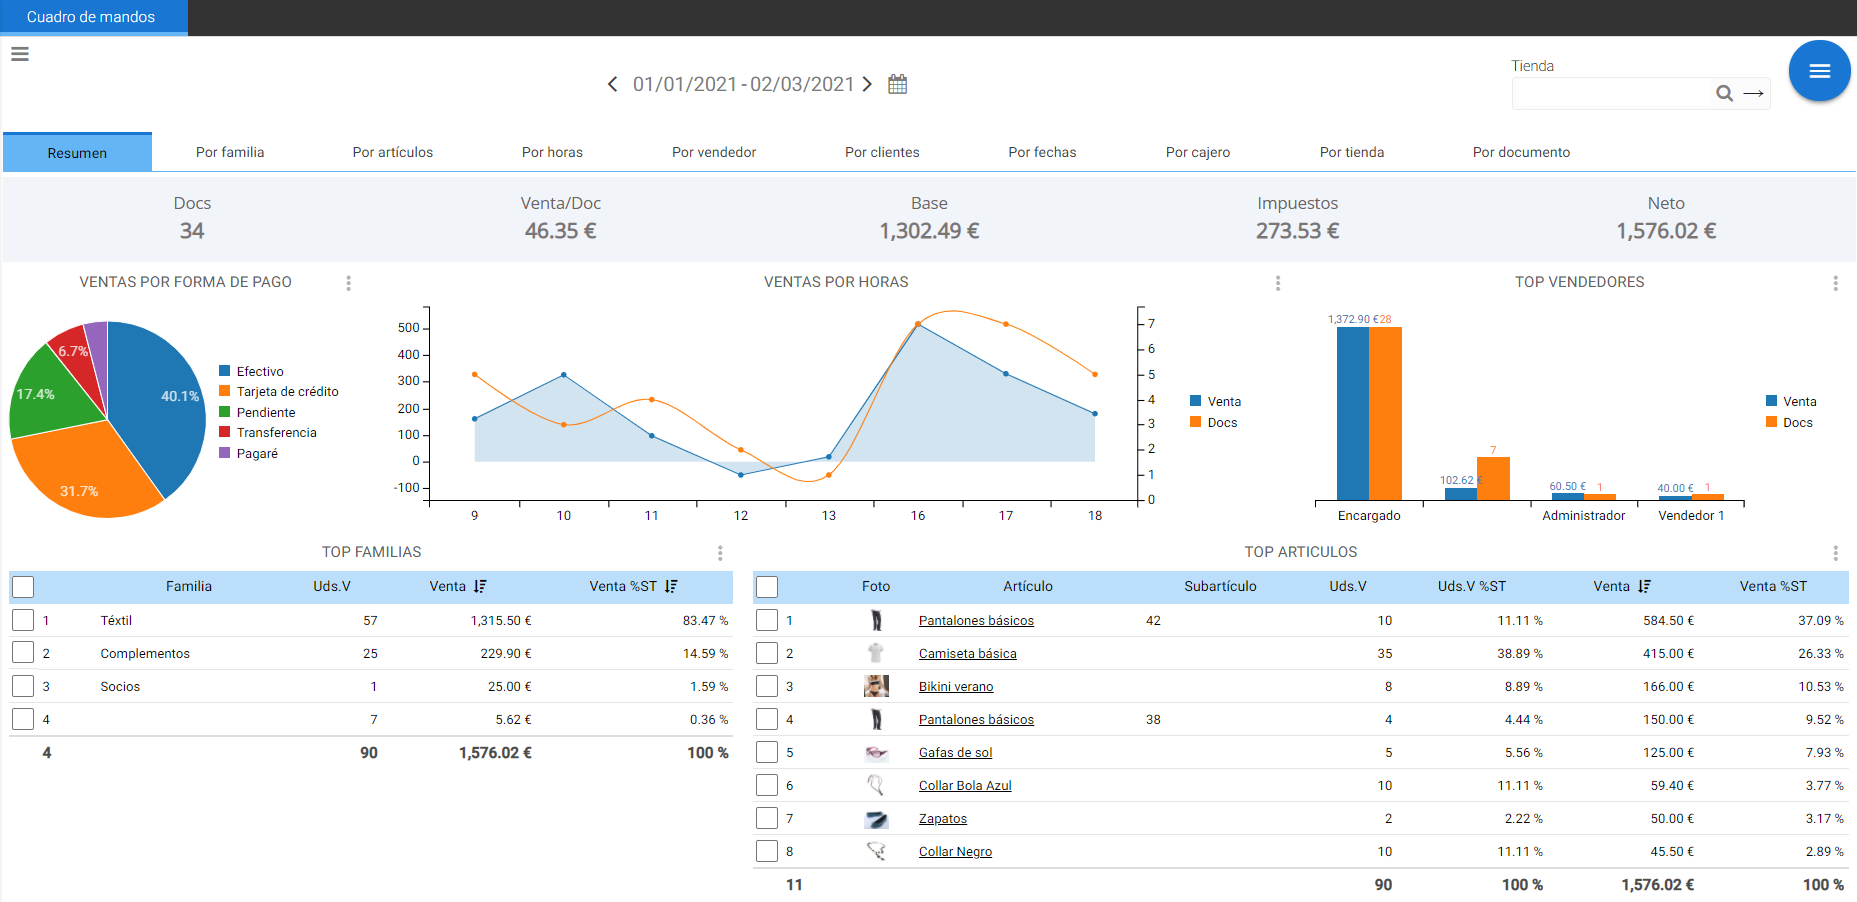
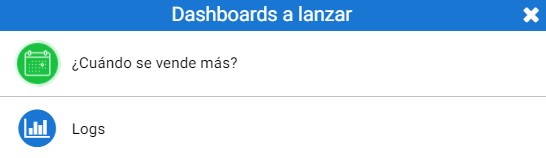
In addition to the data visible in the various tabs of the dashboard, there is a report selector in the upper left corner with options for When do you sell more? and Logs.
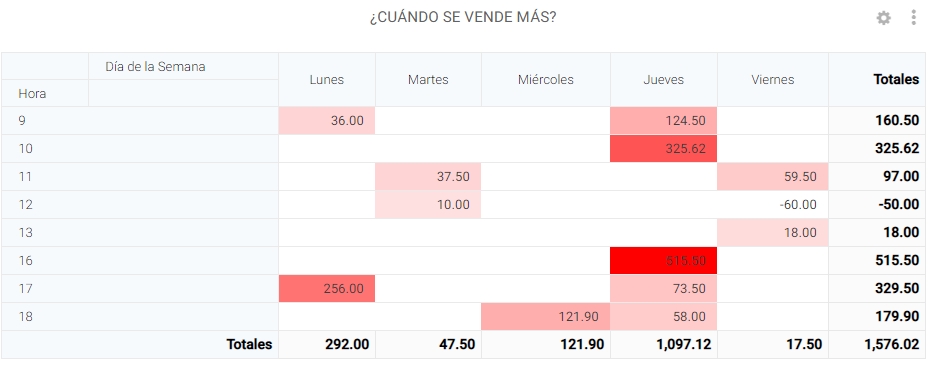
The first report opens a heatmap that shows in red the days of the week that had the most sales in the indicated period, filtered by hours.
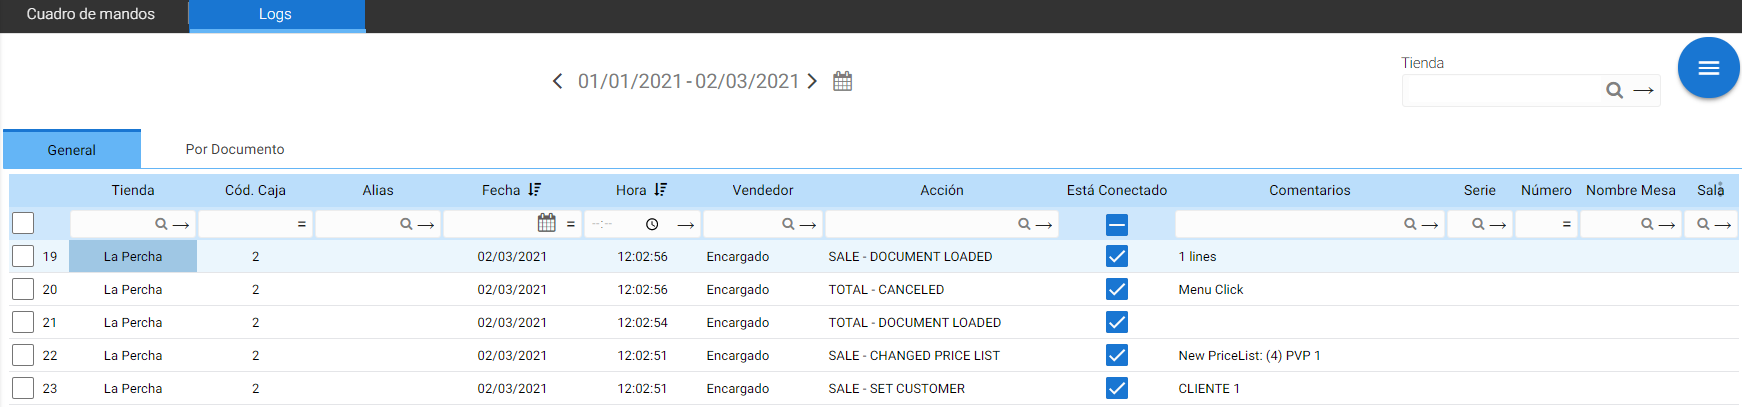
The log report shows the changes made in the database, allows for an audit of the movements and operations performed at the database level, and indicates whether there was a connection for each operation:
AI Assistant
Section summary
AI can generate inaccurate information; verify the results.