En esta sección
Sales
The sales data contains information on all sales, filtered by: document, product family, items, hours, salespeople, customers, dates, cashiers, and establishment.
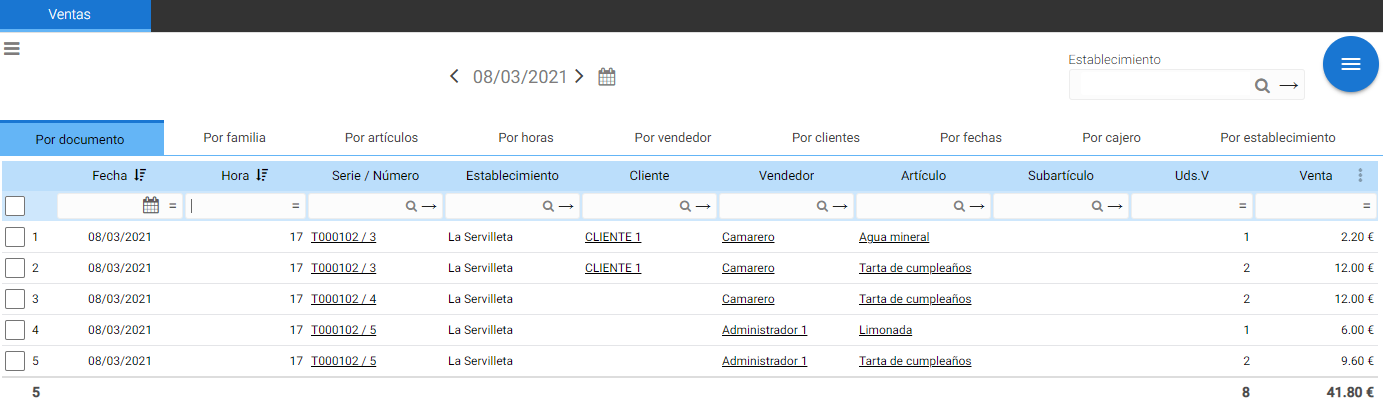
The main tab shows sales by document in a table-style block.
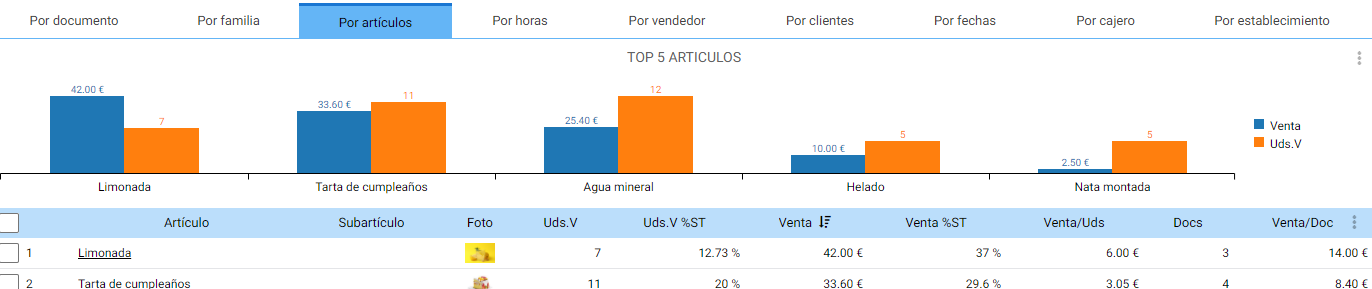
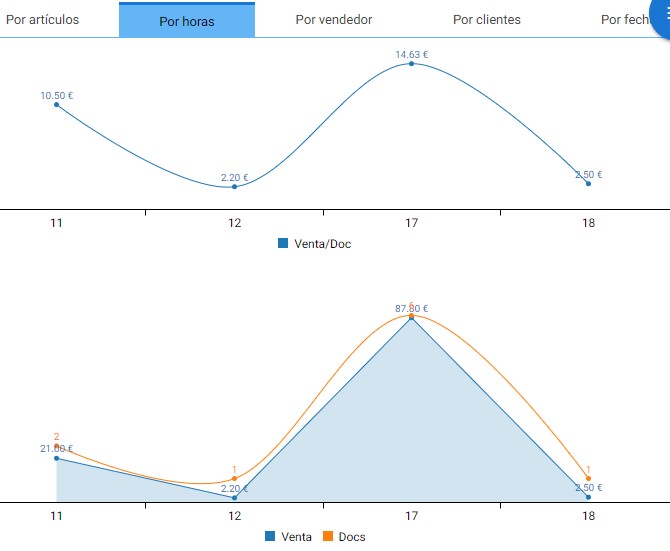
The rest of the tabs, in addition to containing the table with the information for that section, also feature graphs visually representing the results.
In hourly sales, the information is composed of two line graphs:
Two selectors in the header allow viewing sales for a specific date range or store. In the upper left corner, there is a button with a three-horizontal-line icon that offers access to two additional dashboards: When are sales highest? and Schedule.
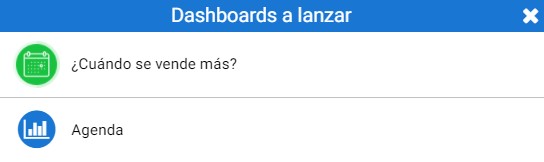
The Schedule Dashboard is useful for terminals that handle temporary tasks or provide services based on predefined schedules, an example being business types such as hair salons.
AI Assistant
Section summary
AI can generate inaccurate information; verify the results.