En esta sección
Margins
Premium*
Divided into six tabs, the representation of the profit margin over costs is located in the dashboards that are in Margins.
The entities for which this information is available are documents, categories, items, customers, dates, and stores; each one has a tab with the data.
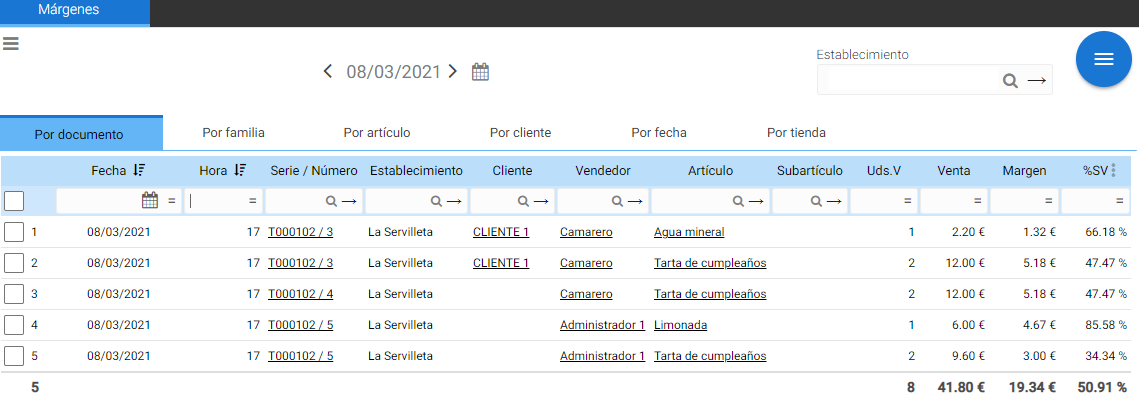
In Margins Per document The amount and percentage of profit obtained from sales are displayed.
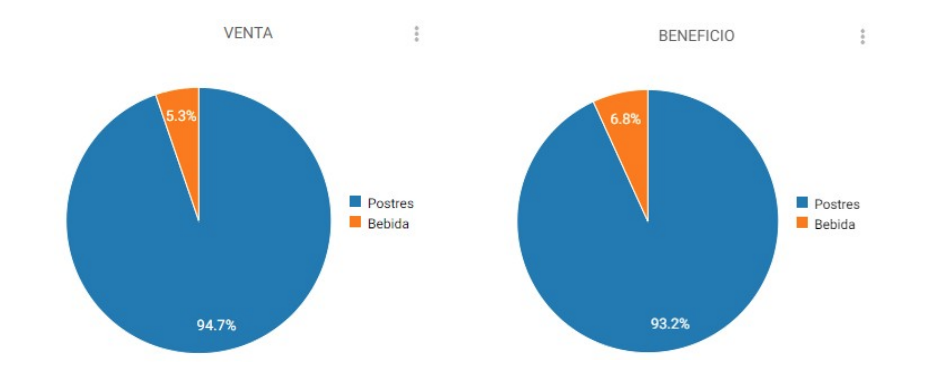
Inside of For family Also found is the information represented in pie charts that allow for quick visualization of the results.
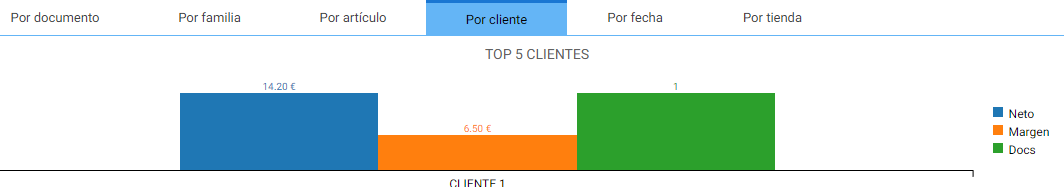
The following options, by customer, date, or store, feature bar charts.
AI Assistant
Section summary
AI can generate inaccurate information; verify the results.